顯示包含「Exercise 20」標籤的文章。顯示所有文章

5/05/2009

Exercise 20-part8

H. Deployment diagram

I learn the deployment diagram from sparxsystems (2009) web site


H1. Scope of deployment diagram

A deployment diagram models the run-time architecture of a system. It shows the configuration of the hardware elements (nodes) and shows how software elements and artifacts are mapped onto those nodes.


H2. Elements of deployment diagram

  • Node - A Node is either a hardware or software element. It is shown as a three-dimensional box shape. (See figure 1.)

    Figure 1. Node symbol of deployment diagram.


  • Node Instance - A node instance can be shown on a diagram. An instance can be distinguished from a node by the fact that its name is underlined and has a colon before its base node type. An instance may or may not have a name before the colon. The figure 2 which shows a named instance of a computer.

Figure 2. Node Instance symbol of deployment diagram.

  • Node Stereotypes - A number of standard stereotypes are provided for nodes, namely «cdrom», «cd-rom», «computer», «disk array», «pc», «pc client», «pc server», «secure», «server», «storage», «unix server», «user pc». These will display an appropriate icon in the top right corner of the node symbol. (See figure 3.)

Figure 3. Node Stereotypes symbol of deployment diagram.

  • Artifact - An artifact is a product of the software development process. That may include process models (e.g. use case models, design models etc), source files, executables, design documents, test reports, prototypes, user manuals, etc.
    An artifact is denoted by a rectangle showing the artifact name, the «artifact» keyword and a document icon(See figure 4.).

Figure 4. Artifact symbol of deployment diagram.

  • Association - In the context of a deployment diagram, an association represents a communication path between nodes. The following diagram shows a deployment diagram for a network, depicting network protocols as stereotypes, and multiplicities at the association ends. (See figure 5.)

Figure 5. Association symbol of deployment diagram.

  • Node as Container - A node can contain other elements, such as components or artifacts. The following diagram shows a deployment diagram for part of an embedded system, depicting an executable artifact as being contained by the motherboard node. (See figure 6.)

Figure 6. Node as Container symbol of deployment diagram.

References:

Sparxsystems (2009). "UML 2 Deployment Diagram". Received 5th May, 2009 from URL -http://www.sparxsystems.com.au/resources/uml2_tutorial/uml2_deploymentdiagram.html

Exercise 20-part7

G. Component Diagram.
I learn the componet diagram from developer(2009).

G1. Scope of component diagram.
The different high-level reusable parts of a system are represented in a Component diagram. A component is one such constituent part of a system. In addition to representing the high-level parts, the Component diagram also captures the inter-relationships between these parts.

G2. Elements of component diagram.
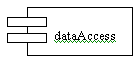
  • Component - The objects interacting with each other in the system. Depicted by a rectangle with the name of the object in it, preceded by a colon and underlined.(See figure 1.)
Figure 1. Componet symbol of componet diagram.
  • Class/Interface/Object - Similar to the notations used in class and object diagrams.(See figure 2.)


Figure 2. Class/Interface/Object symbol of componet diagram.

  • Relation/Association - Similar to the relation/association used in class diagrams. (See figure 3.)


Figure 3. Relation/Association symbol of componet diagram.

References:
Developer (2009). "Component Diagrams in UML". Received 6th May, 2009 from URL - http://www.developer.com/design/article.php/3115721

Exercise 20-part6

F. Activity Diagram
I learn the activity diagram from visualcase (2009) web site

F1. Scope of activity diagram
An activity is the execution of a task whether it be a physical activity or the execution of code. Simply put, the activity diagram shows the sequence of activities.

F2. Elements of activity diagram
  • Start - each activity diagram has one start (see figure 1) at which the sequence of actions begins.


Figure 1. Start symbol of activity diagram

  • End - each activity diagram has one finish at which the sequence of actions ends. (See figure 2)


Figure 2. End symbol of activity diagram

  • Activity - ctivities are connected together by transitions. Transitions are directed arrows flowing from the previous activity to the next activity. They are optionally accompanied by a textual label of the form.(See figure 3)


Figure 3. Activity symbol of activity diagram

  • [guard] label - The guard is a conditional expression that when true indicates that the transition is taken. The label is also optional and is freeform.

  • Conditional behaviour - To show conditional behaviour use a branch and a merge. The top diamond is a branch and has only one transition flowing into it and any number of mutually exclusive transitions flowing out. That is, the guards on the outgoing transitions must resolve themselves so that only one is followed. (See figure 4.) The merge is used to end the conditional behaviour. There can be any number of incoming, and only one outgoing transition. (See figure 5.)

Figure 4. Branch condition symbol of activity diagram.


Figure 5. Merge condition symbol of activity diagram.


  • Parallel behaviour - To show parallel behaviour use a fork and a join. The fork (top) has one transition entering and any number of transitions exiting, all of which will be taken. The join (bottom) represents the end of the parallel behaviour and has any number of transitions entering, and only one leaving. (See figure 6.)

Figure 6. Parallel behaviour symbol of activity diagram.

References:
Visualcase (2009). "Visual Case Tool - UML Tutorial". Received 6th May, 2009 from URL -
http://www.visualcase.com/tutorials/activity-and-state-diagram.htm

Exercise 20-part5

E. Statechart Diagram
I learn the state chart diagram from Smartdraw (2009) web site.

E1. Scope of statechart diagram.
A statechart diagram shows the behavior of classes in response to external stimuli. This diagram models the dynamic flow of control from state to state within a system.

E2. Elements of statechart diagram
  • States - It represent situations during the life of an object. You can easily illustrate a state in SmartDraw by using a rectangle with rounded corners. (See figure 1)

Figure 1. State symbol of statechart diagram.

  • Transition - A solid arrow represents the path between different states of an object. Label the transition with the event that triggered it and the action that results from it. (See figure 2)


Figure 2. Transition symbol of statechart diagram.

  • Initial State - A filled circle followed by an arrow represents the object's initial state. (See figure 3)

Figure 3. Initial State symbol of statechart diagram.

  • Final State - An arrow pointing to a filled circle nested inside another circle represents the object's final state.(See figure 4)


Figure 4. Final State symbol of statechart diagram.

  • Synchronization and Splitting of Control - A short heavy bar with two transitions entering it represents a synchronization of control. A short heavy bar with two transitions leaving it represents a splitting of control that creates multiple states. (See figure 5)

Figure 5. Synchronization and Splitting of Control symbol of statechart diagram.

References:
Smartdraw(2009). "HOW TO DRAW UML DIAGRAMS ". Received 6th May, 2009 from URL -
http://www.smartdraw.com/tutorials/software/uml/tutorial_10.htm

Exercise 20-part4

D. Collaboration Diagram
I learn collaboration diagram from developer(2009) web site
D1. Scope of collaboration diagram
Collaboration diagram shows the objects and their association with other objects in the system apart from how they interact with each other.
D2. Elements of collaboration diagram
  • Object- The objects interacting with each other in the system. Depicted by a rectangle with the name of the object in it, preceded by a colon and underlined (See figure 1).

Figure 1. Object of collaboration diagram.

  • Relation/Association - A link connecting the associated objects. Qualifiers can be placed on either end of the association to depict cardinality.(See figure 2.)

Figure 2. Relation/Association of collaboration diagram.

  • Messages - An arrow pointing from the commencing object to the destination object shows the interaction between the objects. The number represents the order/sequence of this interaction.

Figure 3. Messages of collaboration diagram.

References:

Developer (2009). "Collaboration Diagram in UML". Received 5th May, 2009 from URL -http://www.developer.com/design/article.php/10925_3102981_1

Exercise 20-part3

C. Sequence Diagram.

I learn sequence diagram from sparxsystems web site.

C1. Scope of seqence diagram

A sequence diagram is a form of interaction diagram which shows objects as lifelines running down the page, with their interactions over time represented as messages drawn as arrows from the source lifeline to the target lifeline. Sequence diagrams are good at showing which objects communicate with which other objects; and what messages trigger those communications. Sequence diagrams are not intended for showing complex procedural logic.


C2. Elements of sequence diagram
  • Lifelines - A lifeline represents an individual participant in a sequence diagram. A lifeline will usually have a rectangle containing its object name. If its name is "self", that indicates that the lifeline represents the classifier which owns the sequence diagram.(See figure 1). Sometimes a sequence diagram will have a lifeline with an actor element symbol at its head. This will usually be the case if the sequence diagram is owned by a use case. Boundary, control and entity elements from robustness diagrams can also own lifelines.(See figure 2)

Figure 1. Lifelines of sequence diagram.

Figure 2. More lifelines of sequence diagram.

  • Messages - Messages are displayed as arrows. Messages can be complete, lost or found; synchronous or asynchronous; call or signal. In the following diagram (see figure 3), the first message is a synchronous message (denoted by the solid arrowhead) complete with an implicit return message; the second message is asynchronous (denoted by line arrowhead), and the third is the asynchronous return message (denoted by the dashed line).

Figure 3. Messages of sequence diagram.

  • Lifeline Start and End - A lifeline may be created or destroyed during the timescale represented by a sequence diagram. In the latter case, the lifeline is terminated by a stop symbol, represented as a cross. In the former case, the symbol at the head of the lifeline is shown at a lower level down the page than the symbol of the object that caused the creation. The following diagram shows an object being created and destroyed.(See figure 4)

Figure 4. Lifeline Start and End of sequence.

  • Duration and Time Constraints - By default, a message is shown as a horizontal line. Since the lifeline represents the passage of time down the screen, when modelling a real-time system, or even a time-bound business process, it can be important to consider the length of time it takes to perform actions. By setting a duration constraint for a message, the message will be shown as a sloping line. (See Figure 5).

Figure 5. Duration and Time Constraints of sequence diagram.

  • Gate - A gate is a connection point for connecting a message inside a fragment with a message outside a fragment. EA shows a gate as a small square on a fragment frame. Diagram gates act as off-page connectors for sequence diagrams, representing the source of incoming messages or the target of outgoing messages. The following two diagrams show how they might be used in practice. Note that the gate on the top level diagram is the point at which the message arrowhead touches the reference fragment - there is no need to render it as a box shape. (See figure 6).

Figure 6. Gate of sequence diagram.

  • Part Decomposition - An object can have more than one lifeline coming from it. This allows for inter- and intra-object messages to be displayed on the same diagram.

Figure 7. Part Decomposition of sequence diagram.

References:

sparxsystems (2009). "UML 2 Sequence Diagram". Received 5th May, 2009 from URL - http://www.sparxsystems.com.au/resources/uml2_tutorial/uml2_sequencediagram.html


5/04/2009

Exercise 20-part2

B. Class Diagram.

I learn the class diagram from IBM (2004) web site.

B1. Scope of class diagram
Class diagram provides an initial set of notation elements that all other structure diagrams use.

B2. The elements of class diagram
  • Class - UML uses a special name for these types: "classifiers." Generally, you can think of a classifier as a class, but technically a classifier is a more general term that refers to the other three types above as well. The UML representation of a class is a rectangle containing three compartments stacked vertically, as shown in the figure 1. The top compartment shows the class's name. The middle compartment lists the class's attributes. The bottom compartment lists the class's operations. When drawing a class element on a class diagram, you must use the top compartment, and the bottom two compartments are optional. (The bottom two would be unnecessary on a diagram depicting a higher level of detail in which the purpose is to show only the relationship between the classifiers.
Figure1. Class layout of class diagram.
  • Inheritance - It refers to the ability of one class (child class) to inherit the identical functionality of another class (super class), and then add new functionality of its own. To model inheritance on a class diagram, a solid line is drawn from the child class (the class inheriting the behavior) with a closed, unfilled arrowhead (or triangle) pointing to the super class. (See figure 2)

Figure 2. Inheritance layout of class diagram.

  • Bi-directional (standard) association -An association is a linkage between two classes. Associations are always assumed to be bi-directional; this means that both classes are aware of each other and their relationship, unless you qualify the association as some other type. Going back to our Flight example, the below figure shows a standard kind of association between the Flight class and the Plane class (See figure 3).

Figure 3. Association layout of class diagram

  • Packages - Packages enable modelers to organize the model's classifiers into namespaces, which is sort of like folders in a filing system. Dividing a system into multiple packages makes the system easier to understand, especially if each package represents a specific part of the system.(See figure 4)

Figure 4. Packages layout of class diagram.

  • Interfaces - It is considered to be a specialization of a class modeling element, please see the below figure that is an example package element that shows its members inside the package's rectangle boundaries. (See figure 5)

  • Figure 5. Interfaces layout of class diagram.


  • Aggregation - It is a special type of association used to model a "whole to its parts" relationship. In basic aggregation relationships, the lifecycle of a part class is independent from the whole class's lifecycle. There are 2 types of aggregation, the first one is basic aggregation that is an association with an aggregation relationship indicates that one class is a part of another class. In this kind of aggregation relationship, the child class instance can outlive its parent class (See figure 6). The second one is Composition aggregation that is the composition aggregation relationship that is just another form of the aggregation relationship, but the child class's instance lifecycle is dependent on the parent class's instance lifecycle.(See figure 7).


Figure 6. The basic aggregation of class diagram


Figure 7. The Composition aggregation of class diagram

Referances:

IBM (2004). "UML basics: The class diagram". Received 5th May, 2009 from URL - http://www.ibm.com/developerworks/rational/library/content/RationalEdge/sep04/bell/


Exercise 20-part1


Exercise 20: Modeling with UML

Use Case, Class, Sequence, Collaboration, State chart, Activity, COmponent and Deployment diagrams are used in UML. Describe each of the eight(8) main diagrams used in UML.

A. Use Case Diagram

I learn the Use Case diagram from the tuturial web site, Developer(2009).

A1. Objectiive of Use Case Diagram in UML

A use case diagram is quite simple in nature and depicts two types of elements: one representing the business roles and the other representing the business processes.

A2. The elements of a Use Case Diagram.

  • Actors - it portrays any entity (or entities) that performs certain roles in a given system. The different roles the actor represents are the actual business roles of users in a given system. An actor in a use case diagram interacts with a use case. See below figure.

  • Use Case - A use case in a use case diagram is a visual representation of a distinct business functionality in a system. The key term here is "distinct business functionality."See figure.

  • System boundary - A system boundary defines the scope of what a system will be. functionality."See below figure.


  • Relationships in Use Cases - Use cases share different kinds of relationships. A relationship between two use cases is basically a dependency between the two use cases, for example, when a use case is depicted as using the functionality of another use case in a diagram, this relationship between the use cases is named as an include relationship(See figure 4) ; A relationship between two use cases, the child use case adds to the existing functionality and characteristics of the parent use case, it is named as an extend relationship; A relationship involves a parent-child relationship between use cases. The child use case in the generalization relationship has the underlying business process meaning, but is an enhancement of the parent use case, it is named as generalization relationship.

Include relationship.


Extend Relationship


Generalization relationship.

Refereance:

Developer (2009). "Creating Use Case Diagrams". Received 5th May, 2009 from URL - http://www.developer.com/design/article.php/10925_2109801_1