顯示包含「Exercise」標籤的文章。顯示所有文章

5/11/2009

Exercise 24-part4

4. Computing ethics and bot programming case study: rocky

a. Get an account username and password from the lecturer to LC_MOO at http://ispg.csu.edu.au:7680/ and login to the Welcome Lobby.

I use the account named "train2" and password as "train2" for logging in to the Welcome Lobby .

b. Hold a 5-minute discussion with Rocky on a special topic. Commands: act rocky (start bot) hush rocky (stop bot)

I have sent more than 5-minute discussion with Rocky on a special topic.
And I can order Rocky going anywhere within the Map and order Rocky to doing some action like "take", "drop", "sit"....etc. It is very interesting!! Please see the figure 1. Also, I can teach Rocky to learn something i want it to know. Please see figure 2.

Figure 1. My robot action
Figure 2. An command for Building object.
C. Rocky is an ELIZA-like bot. Report your findings.
Rocky is an ELIZA-like bot, because Rocky can give you a corresponding action when you issue a pre-defined instruction. Please see figure 3 which is telling you how to create an instruction by that command.

Figure 3. An command for teaching Rocky.

5/10/2009

Exercise 26-part2

2. Summarise your understanding and describe its relevance (250 words max) in either your study at university or in your work environment;

After i have studied ITC594 module in CSU, I could further understand what is E-systems Infrastructure development. It can be classified into 5 stages , they are listed from the bottom to top, which are Network, Computing Platform, Middleware, eCommerce applications & services and Business Processes.

In Network field, I have understood the network topologies (e.g. p2p), architecture (e.g. Client/Server and Grid Computing) , protocols (e.g. IP, TCP and ftp), securities(e.g. PGP, SSL and RSA).

In Computing Platform, I have further undestood the database server (e.g. Mysql) and web application server(e.g. Apache, WEBbrick and Mongrel). Specially, further learning the web program language about HTML, CGI, Python, Javascript and Ruby on Rail.

In Middleware field, I have understood the middleware technologies for instance, mobile computing middleware (e.g. WAP), XML-trade (e.g. XML and voice XML), CORBA, SOAP and service-oriented architecture (SOA).


In eCommerce application & services, I have already understood the Electronic marketplaces, Supply chain management (SCM) and customer relationship management(CRM).

And finally, In Business processes, I have fully understood the workflow of E-business (e.g. E-catalogue and Shopping Cart).

Exercise 26-part1

Exercise 26
What to do: The final topic is for group reflective study using the wiki tool in CSU Interact and a way for you to add a final reflective comment on systems integration and make your closing remarks to your Developer's blog.

1. Choose ONE of the four ways to manage and develop integrated systems as listed below;

I choose Federated databases to manage and develop an intergrate system.

PartA. Develop a Federated Database(MySQL, 2008)

a.) we must have two servers running basically, either both on the same host or on different hosts. (It is possible for a FEDERATED table to use another table that is managed by the same server, although there is little point in doing so.

b.) we must have a table on the remote server that we want to access by using a FEDERATED table. Suppose that the remote table is in the federated database and is defined like figure1:

Figure 1.

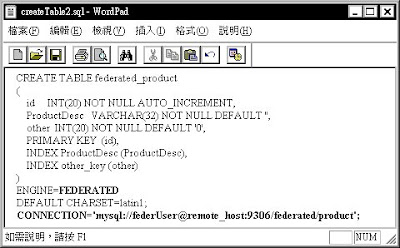
c.) Correspondingly, we should create a FEDERATED table on the local server for accessing the remote table as figure 2:


Figure 2.
The basic structure of this table should match that of the remote table, except that the ENGINE table option should be FEDERATED and the CONNECTION table option is a connection string that indicates to the FEDERATED engine how to connect to the remote server.

d.) The remote host information indicates the remote server to which your local server connects, and the database and table information indicates which remote table to use as the data source. In my development example, the remote server is indicated to be running as remote_host on port 9306, so there must be a MySQL server running on the remote host and listening to port 9306.


Part B. Manage Federated databases

I use HoneyMonitor which is a GUI for MySQL™. Server Administration, Database and Database Objects Administration, Code Development, Server Monitoring, Performance Monitoring, Performance Auditing.

a.) Federated Servers are listed in the Federated Servers node of the Server Objects List (See figure 3), we can create / edit / drop a Federated Server using node's popup menu.

Figure 3.


b.) The SQL Tab (Figure. 4) contain the SQL syntax for recreating the current Server.

Figure 4.

c.) The Create Table Wizard helps you creating tables in a simply and fast way (Figure 5).

Figure 5.

d.) In Connection field, the Federated Server List will be opened thus helping us choosing an existing Federated Server - without the need of writing its name - or creating one more (Figure. 6).

Figure 6.


References:
MySQL (2008). "How to Use FEDERATED Tables". Received 14th May, 2009 from URL - http://dev.mysql.com/doc/refman/5.0/en/federated-use.html


Exercise 25-part4

4. According to Nokia: The Nokia One Mobile Connectivity Service provides easy and secure access to email, calendar, directory and more from a mobile phone, PDA, PC or fixed-line phone -take your corporate applications mobile. Why is a company like Nokia - http://www.nokia.com/ - described as having end-to-end expertise? According to Takeshi Natsuno, media director of Gateway Business Department, NNT mobile Communications Network, Inc (NTT DoCoMo) of Japan: The mobile phone will be an electronic wallet.

Nokia is an end to end expertise because it fulfulls five key steps to create competitiveness through end-to-end innovation(Nokiasiemensnetworks, 2008). :

1. Do the research - First, it' s essential to have a broadunderstanding of end-user needs, as well as market behavior and the challenges you face. Up-to-datemarket research from analysts around the world is one part of the jigsaw.A deeper insight comes from NokiaSiemens Networks' own research and global experience of markets, as well as our close cooperation with Nokia and Siemens and their understanding of end-user behavior.We discuss your needs and aims with you and combine all these elements to paint an accurate picture of your subscribers' needs and the business environment you face.

2. Identify the opportunities for innovation - Innovation can encompass new business models, new revenues and new technologies, which all come together to deliver an exceptional end-user experience. Identifying the opportunities for innovation takes an analysis of the research data, using your own market and business knowledge combined with our expert consulting capability and global experience. The opportunities will vary depending on your preferred business model, homemarket and target user segments. Listening to you, we help to identify opportunities early, while the marketis ripe for development and your competitors are still playing catch-up.

3. Specify the solutions - Services innovation depends on the whole end-to-end chain, encompassing technology aspects like the end-user device, access network and backhaul, core infrastructure, applications, management and operations, as well as striking the appropriate partnership deals with other playersin the ecosystem. It's essential to take into account all these aspects when creating solutions customized to your needs. As a leading solutions provider in mobile and fixed environments, we have the capability and resources to help you establish clear business goals and provide every link in the chain. You remain free to choose the services and solutions you want,whether devices, network design, infrastructure elements including thirdparty products, applications, network operations, managed services, or acomplete package.

4.Implement your plans - Having established the right solution, it needs to be implemented quickly and efficiently while retaining simplicity and quality, including proper interoperability.Our Solutioneers use proven processes to ensure an end-to-end focus when developing and delivering your solution. We can integrate entire systems or selected components to tailor solutions to your needs. Launching new services, rolling out infrastructure and improving business processes becomes efficient and fast. Project management, services and marketing support, network operation and competence transferhelp make it all happen.
We can also be a strategic partner in the marketing of your servicelaunch, providing practical
co-marketing support to gain maximum revenues and profits.

5. Evolve your services portfolio - Markets move fast and it's vital to evolve services quickly to stayahead. Constant research is needed to predict changing user behavior and find new ways to improve theunderlying technology. This is an ongoing process, including planning roadmaps and lifecycle management for services, devices and networks. We constantly update our research to stay ahead of markettrends. Such intelligence is central to our dialog with you, helping to guide continuous solution development and process improvement, and leverage technology developments to enhance existing services and create new ones.Our commitment to R&D is fundamental in creating theinnovation you need to meet yourevolving requirements. This starts right back up the supply chain, withour close co-operative working relationships with early suppliers,such as chip manufacturers.

References:
Nokiasiemensnetworks (2008). "End-to-end expertise - our offering". Received 11th May, 2009 from URL - http://www.nokiasiemensnetworks.com/cn/Insight/end-to-end/end-to-end-expertise.htm?languagecode=en

Exercise 25-part3

3. Visit the W3C website and find the status of the VoiceXML project. When do you think it will affect business on the web and what will its impact be?

W3 (2008) states that the Voice Browser Working Group has published the First Public Working Draft of Voice Extensible Markup Language (VoiceXML) 3.0. This document specifies VoiceXML 3.0, a modular XML language for creating interactive media dialogs that feature synthesized speech, recognition of spoken and DTMF key input, telephony, mixed initiative conversations, and recording and presentation of a variety of media formats including digitized audio, and digitized video. The primary goal of this version is to bring the advantages of Web-based development and content delivery to interactive voice response applications.

When gauging VoiceXML server performance, Cisco (2009) states that the key aspects to consider are:
• Network bandwidth between Web application server and the VoiceGateway and QOS.
• Performance on the VoiceXML Server - CVP Bill of Materials (BOM) requires the MCS-7845 as a VoiceXML server. Adequate performanceis required on the server side to respond to VoiceXML over HTTP requests.
• Use of pre-recorded Audio vs. Text to Speech - Good Voice User Interface applications tend to use pre-recorded audio files wherever possible.Recorded audio sounds much better than TTS. Pre-recorded Audio file quality needs to be designedsuch that it does not impact download time and browser interpretation. Make recordings in 8-bit Mulaw 8Khz format.
• Audio File Caching - Make sure the Voice gateway is set to cache Audio content prevents delays in having to downloadfiles from the media source.Refer to the Section titled Gateway Prompt Caching Considerations for more details on PromptManagement on Supported Gateways
• Use of Grammars - A voice application, like any user-centric application, is prone to certain problems that might onlybe discovered through formal usability testing, or observation of the application in use. Poor speech recognition accuracy is one type of problem common to voice applications, and a problem mostoften caused by poor grammar implementation. When users mispronounce words or say things that the grammar designer does not expect, the recognizer cannot match their input against the grammar.Poorly designed grammars containing many difficult-to-distinguish entries also results in manymisrecognized inputs leading to decreased performance on the VoiceXML server.Grammar tuning is the process of improving recognition accuracy by modifying a grammar basedon an analysis of its performance.

Hence, in order to implement the VoiceXML on their web, business needs focus on above points.
Otherwise, poor performance with VoiceXML will result in negative response.

References:
W3 (2008). "
W3C Home Page News Archive". Received 10th May, 2009 from URL -http://www.w3.org/News/2008

Cisco (2009). "Design Implications for VoiceXML Server". Received 10th May, 2009 from URL -
Design Implications for VoiceXML Server

Exercise 25-part2

2. Visit an airline Web site and search for information on WAP or SMS access to booking airline services. Do the same for WAP or SMS services in banking. How do both industries compare?

I visit an airline web site named Northwest Airlines (http://www.nwa.com/)

And I study their work flow of booking airline services used WAP in the following:

Step 1.) Passenger checks in online and opts for mobile boarding pass.


Step 2. ) NWA's check-in system transmits the relevant data - barcode number, mobile phone number, handset make and model and dynamice text underneath (seat number, flight destination to Mobiqa (mobiqa 2009) which is a travel web agent in XML format. Mobiqa's API is available on request.


Step 3.) Mobiqa send out the mobile tickets either by WAP push, Email (link html attachment) pr MMS to the customer's mobile phone.


Step 4.) Passengers take their monile phone and it is scanned at security and the boarding gate.


Step 5.) Scanner used were Desko GRSK 500 either containing or linking to the original ticketing platform that sold the ticket in the first place to compete validation.


Generally, there are little different of using WAP service beween booking airline services and mobile banking, for example

a.) Your cellphone when using WAP banking service that must have got the Security certificate before doing any operation.

b.) Your bank account must be linked with your phone card number.

References:

Mobiqa (2009). "Products". Received 10th May, 2009 from URL - http://www.mobiqa.com/airlines/products.html


5/09/2009

Exercise 25-part1

Exercise 25: M-commerce and the e-wallet: Innovation and mobile devices

Explore ONE of the problems associated with mobile technology or their supplier, from 1 to 4 below:

1. What is meant by a location based service?

Wikipedia (2009) states that A location-based service (LBS) is an information and entertainment service, accessible with mobile devices through the mobile network and utilizing the ability to make use of the geographical position of the mobile device. LBS services can be used in a variety of contexts, such as health, work, personal life, etc. LBS services include services to identify a location of a person or object, such as discovering the nearest banking cash machine or the whereabouts of a friend or employee. LBS services include parcel tracking and vehicle tracking services. LBS can include mobile commerce when taking the form of coupons or advertising directed at customers based on their current location.

References:
Wikipedia (2009). "Location based service". Received 10th May, 2009 from URL -
http://en.wikipedia.org/wiki/Location_based_service.

Exercise 24-part3

3. Identify various activities in e-commerce where software agents are currently in use.

Umn (1999) tells me that there are various activities in e-commerce where software agents are currently in use as follows.
a. ) Procurement: obtaining materials, services. managing inflow into the organization towards the end user.
b.) Brokering Services: finding information about products, sellers, and prices, providing protection for privacy, validating purchasers credit, billing and accounting, etc.
c.) Digital Libraries and Recommending Services: retrieving information from distributed sources, filtering information on contents, collaborative filtering.
d.) Notification Services: notifying of new books or CDs, notifying when specific products are available at a specific price.

References:
Umn (1999). "Intelligent agents for E-Commerce". Received 10th May, 2009 from URL -
http://www-users.cs.umn.edu/~gini/csom.html

5/06/2009

Exercise 24-part2

2. Describe how techniques such as artificial intelligence and statistical techniques are used in software agents.

Erols (2000) states that AI technologies extend from the word Technology which stems from the Greek word technos, which means "art" and "skill." A sophisticated technology is then a cumulative building of learned and well-refined skills and processes. In the AI area, these processes have manifested themselves in a number of well-recognized and maturing areas including Neural Networks, Expert Systems, Automatic Speech Recognition, Genetic Algorithms, Intelligent Agents, Natural Language Processing, Robotics, Logic Programming, and Fuzzy Logic. Each of these areas will be examined in some depth here, but it is first important to understand that the importance of these individual areas has changed over the last two decades. These changes have been based upon the progress in each area, and the needs that each area meets. For example in the early 1980’s robotics was a large thrust in artificial intelligence. At that time benefits could be seen in manufacturing applications. In the late 1990’s the blossoming of the Internet pushed the importance of intelligent agents forward for performing routine tasks and complex searches. At the same time, throughout the 1980s and 1990s, orders of magnitude advances in computer processing power have allowed hurdles in speech recognition and image processing to be overcome. The maturity of each of these technology areas also differs. Expert Systems and Automatic Speech Recognition are among the most mature while Natural Language Processing and Intelligent Agents remain in early stages of development. In the next few paragraphs the basis for each of these technologies will be reviewed. In addition examples where the technologies have been effectively utilized will be presented.

Wikipedia(2009) tells me there are some statistical techniques , for example, Analysis of variance (ANOVA), Chi-square test, Correlation, Factor Analysis, Mann-Whitney U,
Mean Square Weighted Deviation MSWD, Pearson product-moment correlation coefficient
Regression analysis, Spearman's rank correlation coefficient, Time Series Analysis, etc.


References:
Erols (2000). "A Primer on Artificial Intelligence Technologies ". Received 10th May, 2009 from URL -
http://users.erols.com/jsaunders/papers/aitechniques.htm.

Wikipedia (2009). "Statistics ". Received 10th May, 2009 from URL -
http://en.wikipedia.org/wiki/Statistics.

Exercise 24-part1

Exercise 24: Virtual business worlds and cyber agents

Search the Web for a site that uses a cyber character or cyber agent to host a business site. (If you create a successful cyber agent, you mat be able to get large companies to use it to sell their products online.)

1. Differentiate the various types of software agents.

Kfupm(1996) states that software agent can be classified 8 types.

There are collaborative agents, interface agents, mobile agents, information agents, reactive agents, hybrid agents, heterogeneous agent systems and smart agents. (See figure 1.)

Figure 1. A Classification of Software Agents

a.) Collaborative agents emphasise autonmy and cooperation (with other agents). Hence, they may have to negotiate in order to reach mutually acceptable agreements on some matters. They typically are large coarse-grained, deliberative-style agents with non-trivial internals.(Alex L. G. Hayzelden,1999)

b.) Interface agents / Information agents emphasise autonomy and learning in order to perform tasks for their owner. Pattie Maes, a key proponent of this class of agents, points out that the key metaphor underlying interface agents is that of a personal assistant who is collaborating with the user in the same work environment. Note the subtle emphasis and distinction between collaborating with the user and collaborating with other agents as is the case with collaborative agents.(Alex L. G. Hayzelden,1999)

c.) Mobile agents emphasise deploying mobile code that is the adoption of mobile agent technology. Mobile agent technology is concerned with the ability to move executable code from one computer to another.(Alex L. G. Hayzelden,1999)

d.) Reactive agents represent a special category of agents which do not possess internal,symbolic models of their environments; instead they act/respond in a stimulus-responsemanner to the present state of the environment in which they are embedded. (Kfupm, 1996 )

e.) Hybrid agents refer to those whose constitution is a combination of two or more agent philosophies within asingular agent. The key hypothesis for having hybrid agents or architectures is the belief that, for someapplication, the benefits accrued from having the combination of philosophies within asingular agent is greater than the gains obtained from the same agent based entirely on asingular philosophy. Otherwise having a hybrid agent or architecture is meaningless. Clearly,the motivation is the expectation that this hypothesis would be proved right; the ideal benefitswould be the set union of the benefits of the individual philosophies in the hybrid.(Alex L. G. Hayzelden,1999)

f.) Heterogeneous agent systems refer to an integrated set-up of at least two or more agents which belong to two or more different agent classes. The essential rationale for them is that the world abounds with a rich diversity of software products providing a wide range of services for a similarly wide range of domains. (Alex L. G. Hayzelden,1999)

g.) Smart agents are a new form of software agent that interface with other agents forming an artificial intelligence system. The acronym "SMART" stands for "System for Managing Agents in Real Time". This is a bit of a misnomer because the agents manage themselves and each other by agreeing to become part of the collective whole. SMART Agents work together, within a SMART system, to perform smaller pieces of larger programming tasks so that the combined collective can achieve great things with relatively simple programming building blocks. (Wikipedia, 2009).


References:

Alex L. G. Hayzelden(1999). "Software agents for future communication systems".Springer Publisher. pp 70-200.

Kfupm(1996). "Software Agents". Received 6th May, 2009 from URL - http://reference.kfupm.edu.sa/content/s/o/software_agents__an_overview__83303.pdf

Wikipedia (2009). "Smart Agents". Received 6th May, 2009 from URL - http://en.wikipedia.org/wiki/SMART_Agents

Exercise 23

Exercise 23: Searching mechanisms

1. What is a spider? What does it do?
Webopedia (2009) states that a spider is a program that automatically fetches Web pages. Spiders are used to feed pages to search engines. It's called a spider because it crawls over the Web. Another term for these programs is webcrawler. Because most Web pages contain links to other pages, a spider can start almost anywhere. As soon as it sees a link to another page, it goes off and fetches it. Large search engines, like Alta Vista, have many spiders working in parallel.

2. What is a meta-search engine? Provide some examples.
Wikipedia (2009) explains that a meta-search engine is a search tool that sends user requests to several other search engines and/or databases and aggregates the results into a single list or displays them according to their source. Metasearch engines enable users to enter search criteria once and access several search engines simultaneously. Metasearch engines operate on the premise that the Web is too large for any one search engine to index it all and that more comprehensive search results can be obtained by combining the results from several search engines. This also may save the user from having to use multiple search engines separately.

The examples of meta-search engine are listed in the following:
a.) Chofter meta-search engine (
http://www.chofter.com/)
b.) Dogpile meta-search engine (
http://www.dogpile.com/)
c.) Ixquick meta-search engine (
http://www.ixquick.com/)

3. How can you get your site listed at major search sites; and how could you improve your site ranking?

We can get our site listed at major search sites by following methods:

a.) The website named AllTheWeb (http://www.alltheweb.com/) that is owned by overture. It also provides results for Lycos. And it provides a free submission. You can add your web site's URL by this link http://www.alltheweb.com/add_url.php.

b.) The website named Altavista (http://www.altavista.com/) that is owned by overture. It also provides a free submission. You can add your web site's URL by this link http://www.altavista.com/addurl/new.

c.) The website named Google (http://www.google.com/) that is the top choice for searchers. It's search engineresults also appear in Yahoo and AOL. You can add your web site's URL by this link http://www.google.com/addurl.html.

We can improve our web site ranking by the following methods.

a.) Place keywords in your web pages by following Isitebuild(2006) 's suggestion.

  • Title Tag - This tag should contain your most important keyword phrase. Make the title interesting enough to grab the visitor's attention. Only use 5 to 6 words in your title with your most relevant keyword in the beginning.
  • Description Meta Tag - The search engines often use this tag when they display the description of your web site in the search results. Try to make the description inviting for your visitors. The length should be less than 200 characters, including spaces.
  • Keyword Meta Tag - This tag will contain a listing of your keywords and keyword phrases that are relevant to your page and enable a Search Engine to find you.Here are some things to remember: (1) Don't use the same keyword more than 3 times. (2) Use keywords that occur in your Title Tag and Description Tag. (3) Use only 200 characters for all your keywords. (4)Use different keywords for all your pages. (4) Only use keywords that are relevant to your site. (5) Use lower case letters. (6) Use the single and plural forms of your keywords. (7) Use commas or spaces between your keywords or keyword phrases.
  • Heading Tags - These tags hold separate topics between paragraphs and range from h1, which is very large and bold to h6, which is very small and bold. Your page heading should contain your most important keywords or keyword phrase.
  • Alt Tag - This tag is used to add text in place of the image. The user may haveturned off reading the graphics to make the page load faster. Therefore he will read the ALT Tag text instead.Add short keyword rich text to your graphic links. Make sure theALT text describes the link destination.
  • Hypertext Links - Include your keywords or keyword phrase in your link text.
  • Content - Search Engine spiders put more weight on keyword richcontent that is higher up on the page rather than in the middleor lower sections. Insert your keywords and keyword phrases inyour text at least three times.
  • Types of Sites that won't get indexed by Search Engines. - Flash and Frame Sites - pages created this way will be avoidedby the Search Engines spiders. Dynamic Pages - any web address that contains a question mark(i.e. ASP, Perl, Cold Fusion), will not be indexed by thespiders. Password Protected Pages - Search Engines Spiders will not indexany area that is protected by a password.
  • Use Meta Tag Generators - These are tools that can be used to automatically generate yourkeywords. Here are some resources you can use:http://www.bcentral.com/products/metatags.asp

References:

Webopedia(200). "Spider". Received 6th May, 2009 from URL - http://www.webopedia.com/TERM/s/spider.html

Wikipedia (2009). "Metasearch engine". Received 6th May, 2009 from URL -
http://en.wikipedia.org/wiki/Metasearch_engine

Isitebuild (2006). "How to Use Keywords to Optimize Your Sitefor Search Engines-Part 2 ".Received 6th May, 2009 from URL -
http://www.isitebuild.com/keywords2.htm

5/05/2009

Exercise 22

Exercise 22.
Differentiate between software systems such as Customer Relationship Management (CRM) software, Business-to Business e-commerce programs and Supply-Chain Management (SCM) software.

Customer Relationship Management (CRM) system includes tools, technologies and procedures that allow managing, improving and facilitating sales, support and related interactions with customers, prospects, and business partners throughout the enterprise. The main goal of a CRM system is to help sales and marketing people to analyze of customer behavior and its value for the organization by using technology and human resources. Research already made in this area states that, using CRM systems, organizations may obtain loyal and more satisfied customers by improving their business, reducing acquisition costs and gaining acknowledgment of their brand, which it is translated to a better financial performance. Some organizations only implement some functionalities of a CRM system and, although this action may limit the whole system functionality, it is a great step towards integrating the missing modules in the future to achieve a complete implementation. (Iseing, 2007).

On the other hand, a Supply Chain Management (SCM) System is a packaged technological solution that, after its deployment, it offers to the organization several advantages to coordinate their raw material acquisition, production and logistic processes, and at the same time, it improves relationship with customer and suppliers, building longterm strategic alliances. We can define a SCM system as the technological solution that manages and give support to activities related with product delivery, from raw material management until the final product reaches the end customer. It includes processes for raw material acquisition, production and assembly, storage, inventory control, order management, distribution along commercial channels and customer delivery. A SCM system will allow the organization to automate and control in a better way processes related to product acquisition, production and warehousing in order to obtain the desired benefits. (Iseing, 2007).

CRM systems are usually projects whose application needs to be prepared to quickly respond to changes in the requirements, maybe one of the reasons being the dynamic and sometimes unstable environment of the commercial processes in the organizations. For example, most of the time the marketing department needs to adequate their processes to obtain new information about competitors, clients, new markets and market tendencies. On the other hand, in the SCM home grounds usually systems implementations require coordination of many members of the logistic chain, involving a large working team that needs a well-based and detailed plan to pursue the success of the overall SCM implementation process. Additionally, while SCM systems deal with information processing for operational transactional purposes, CRM systems concentrate more on information analysis for commercial decision support. (Iseing 2007).

Referances:
Iseing (2007). "IMPLEMENTATION APPROACHES FOR EXTENDED ENTERPRISESYSTEMS: COMPARATIVE ANALYSIS OF CRM AND SCM SYSTEMS IMPLEMENTATIONAPPROACHES". Received 6th May, 2009 from URL - http://www.iseing.org/emcis/EMCIS2007/emcis07cd/EMCIS07-PDFs/704.pdf

Exercise 21

Exercise 21 .Develop the class diagram for the following shopping cart specifications:

A shoppingCart object is associated with only one creditCard and customer and to items in itemToBuy object, Persistent customer information such as name, billing address, delivert address, e-mail address and credit rating is stored in the customer object. The credit card object is associated with a frequentShopper discount object, if the credit rating for the customer is good. The customer can make or cancel orders as well as add and delete items to the shopping cart producti. The credit card object contains the secure method for checking that the charge is authentic.

My class diagram is showed in the following:

Exercise 20-part8

H. Deployment diagram

I learn the deployment diagram from sparxsystems (2009) web site


H1. Scope of deployment diagram

A deployment diagram models the run-time architecture of a system. It shows the configuration of the hardware elements (nodes) and shows how software elements and artifacts are mapped onto those nodes.


H2. Elements of deployment diagram

  • Node - A Node is either a hardware or software element. It is shown as a three-dimensional box shape. (See figure 1.)

    Figure 1. Node symbol of deployment diagram.


  • Node Instance - A node instance can be shown on a diagram. An instance can be distinguished from a node by the fact that its name is underlined and has a colon before its base node type. An instance may or may not have a name before the colon. The figure 2 which shows a named instance of a computer.

Figure 2. Node Instance symbol of deployment diagram.

  • Node Stereotypes - A number of standard stereotypes are provided for nodes, namely «cdrom», «cd-rom», «computer», «disk array», «pc», «pc client», «pc server», «secure», «server», «storage», «unix server», «user pc». These will display an appropriate icon in the top right corner of the node symbol. (See figure 3.)

Figure 3. Node Stereotypes symbol of deployment diagram.

  • Artifact - An artifact is a product of the software development process. That may include process models (e.g. use case models, design models etc), source files, executables, design documents, test reports, prototypes, user manuals, etc.
    An artifact is denoted by a rectangle showing the artifact name, the «artifact» keyword and a document icon(See figure 4.).

Figure 4. Artifact symbol of deployment diagram.

  • Association - In the context of a deployment diagram, an association represents a communication path between nodes. The following diagram shows a deployment diagram for a network, depicting network protocols as stereotypes, and multiplicities at the association ends. (See figure 5.)

Figure 5. Association symbol of deployment diagram.

  • Node as Container - A node can contain other elements, such as components or artifacts. The following diagram shows a deployment diagram for part of an embedded system, depicting an executable artifact as being contained by the motherboard node. (See figure 6.)

Figure 6. Node as Container symbol of deployment diagram.

References:

Sparxsystems (2009). "UML 2 Deployment Diagram". Received 5th May, 2009 from URL -http://www.sparxsystems.com.au/resources/uml2_tutorial/uml2_deploymentdiagram.html

Exercise 20-part7

G. Component Diagram.
I learn the componet diagram from developer(2009).

G1. Scope of component diagram.
The different high-level reusable parts of a system are represented in a Component diagram. A component is one such constituent part of a system. In addition to representing the high-level parts, the Component diagram also captures the inter-relationships between these parts.

G2. Elements of component diagram.
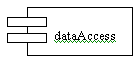
  • Component - The objects interacting with each other in the system. Depicted by a rectangle with the name of the object in it, preceded by a colon and underlined.(See figure 1.)
Figure 1. Componet symbol of componet diagram.
  • Class/Interface/Object - Similar to the notations used in class and object diagrams.(See figure 2.)


Figure 2. Class/Interface/Object symbol of componet diagram.

  • Relation/Association - Similar to the relation/association used in class diagrams. (See figure 3.)


Figure 3. Relation/Association symbol of componet diagram.

References:
Developer (2009). "Component Diagrams in UML". Received 6th May, 2009 from URL - http://www.developer.com/design/article.php/3115721

Exercise 20-part6

F. Activity Diagram
I learn the activity diagram from visualcase (2009) web site

F1. Scope of activity diagram
An activity is the execution of a task whether it be a physical activity or the execution of code. Simply put, the activity diagram shows the sequence of activities.

F2. Elements of activity diagram
  • Start - each activity diagram has one start (see figure 1) at which the sequence of actions begins.


Figure 1. Start symbol of activity diagram

  • End - each activity diagram has one finish at which the sequence of actions ends. (See figure 2)


Figure 2. End symbol of activity diagram

  • Activity - ctivities are connected together by transitions. Transitions are directed arrows flowing from the previous activity to the next activity. They are optionally accompanied by a textual label of the form.(See figure 3)


Figure 3. Activity symbol of activity diagram

  • [guard] label - The guard is a conditional expression that when true indicates that the transition is taken. The label is also optional and is freeform.

  • Conditional behaviour - To show conditional behaviour use a branch and a merge. The top diamond is a branch and has only one transition flowing into it and any number of mutually exclusive transitions flowing out. That is, the guards on the outgoing transitions must resolve themselves so that only one is followed. (See figure 4.) The merge is used to end the conditional behaviour. There can be any number of incoming, and only one outgoing transition. (See figure 5.)

Figure 4. Branch condition symbol of activity diagram.


Figure 5. Merge condition symbol of activity diagram.


  • Parallel behaviour - To show parallel behaviour use a fork and a join. The fork (top) has one transition entering and any number of transitions exiting, all of which will be taken. The join (bottom) represents the end of the parallel behaviour and has any number of transitions entering, and only one leaving. (See figure 6.)

Figure 6. Parallel behaviour symbol of activity diagram.

References:
Visualcase (2009). "Visual Case Tool - UML Tutorial". Received 6th May, 2009 from URL -
http://www.visualcase.com/tutorials/activity-and-state-diagram.htm

Exercise 20-part5

E. Statechart Diagram
I learn the state chart diagram from Smartdraw (2009) web site.

E1. Scope of statechart diagram.
A statechart diagram shows the behavior of classes in response to external stimuli. This diagram models the dynamic flow of control from state to state within a system.

E2. Elements of statechart diagram
  • States - It represent situations during the life of an object. You can easily illustrate a state in SmartDraw by using a rectangle with rounded corners. (See figure 1)

Figure 1. State symbol of statechart diagram.

  • Transition - A solid arrow represents the path between different states of an object. Label the transition with the event that triggered it and the action that results from it. (See figure 2)


Figure 2. Transition symbol of statechart diagram.

  • Initial State - A filled circle followed by an arrow represents the object's initial state. (See figure 3)

Figure 3. Initial State symbol of statechart diagram.

  • Final State - An arrow pointing to a filled circle nested inside another circle represents the object's final state.(See figure 4)


Figure 4. Final State symbol of statechart diagram.

  • Synchronization and Splitting of Control - A short heavy bar with two transitions entering it represents a synchronization of control. A short heavy bar with two transitions leaving it represents a splitting of control that creates multiple states. (See figure 5)

Figure 5. Synchronization and Splitting of Control symbol of statechart diagram.

References:
Smartdraw(2009). "HOW TO DRAW UML DIAGRAMS ". Received 6th May, 2009 from URL -
http://www.smartdraw.com/tutorials/software/uml/tutorial_10.htm

Exercise 20-part4

D. Collaboration Diagram
I learn collaboration diagram from developer(2009) web site
D1. Scope of collaboration diagram
Collaboration diagram shows the objects and their association with other objects in the system apart from how they interact with each other.
D2. Elements of collaboration diagram
  • Object- The objects interacting with each other in the system. Depicted by a rectangle with the name of the object in it, preceded by a colon and underlined (See figure 1).

Figure 1. Object of collaboration diagram.

  • Relation/Association - A link connecting the associated objects. Qualifiers can be placed on either end of the association to depict cardinality.(See figure 2.)

Figure 2. Relation/Association of collaboration diagram.

  • Messages - An arrow pointing from the commencing object to the destination object shows the interaction between the objects. The number represents the order/sequence of this interaction.

Figure 3. Messages of collaboration diagram.

References:

Developer (2009). "Collaboration Diagram in UML". Received 5th May, 2009 from URL -http://www.developer.com/design/article.php/10925_3102981_1

Exercise 20-part3

C. Sequence Diagram.

I learn sequence diagram from sparxsystems web site.

C1. Scope of seqence diagram

A sequence diagram is a form of interaction diagram which shows objects as lifelines running down the page, with their interactions over time represented as messages drawn as arrows from the source lifeline to the target lifeline. Sequence diagrams are good at showing which objects communicate with which other objects; and what messages trigger those communications. Sequence diagrams are not intended for showing complex procedural logic.


C2. Elements of sequence diagram
  • Lifelines - A lifeline represents an individual participant in a sequence diagram. A lifeline will usually have a rectangle containing its object name. If its name is "self", that indicates that the lifeline represents the classifier which owns the sequence diagram.(See figure 1). Sometimes a sequence diagram will have a lifeline with an actor element symbol at its head. This will usually be the case if the sequence diagram is owned by a use case. Boundary, control and entity elements from robustness diagrams can also own lifelines.(See figure 2)

Figure 1. Lifelines of sequence diagram.

Figure 2. More lifelines of sequence diagram.

  • Messages - Messages are displayed as arrows. Messages can be complete, lost or found; synchronous or asynchronous; call or signal. In the following diagram (see figure 3), the first message is a synchronous message (denoted by the solid arrowhead) complete with an implicit return message; the second message is asynchronous (denoted by line arrowhead), and the third is the asynchronous return message (denoted by the dashed line).

Figure 3. Messages of sequence diagram.

  • Lifeline Start and End - A lifeline may be created or destroyed during the timescale represented by a sequence diagram. In the latter case, the lifeline is terminated by a stop symbol, represented as a cross. In the former case, the symbol at the head of the lifeline is shown at a lower level down the page than the symbol of the object that caused the creation. The following diagram shows an object being created and destroyed.(See figure 4)

Figure 4. Lifeline Start and End of sequence.

  • Duration and Time Constraints - By default, a message is shown as a horizontal line. Since the lifeline represents the passage of time down the screen, when modelling a real-time system, or even a time-bound business process, it can be important to consider the length of time it takes to perform actions. By setting a duration constraint for a message, the message will be shown as a sloping line. (See Figure 5).

Figure 5. Duration and Time Constraints of sequence diagram.

  • Gate - A gate is a connection point for connecting a message inside a fragment with a message outside a fragment. EA shows a gate as a small square on a fragment frame. Diagram gates act as off-page connectors for sequence diagrams, representing the source of incoming messages or the target of outgoing messages. The following two diagrams show how they might be used in practice. Note that the gate on the top level diagram is the point at which the message arrowhead touches the reference fragment - there is no need to render it as a box shape. (See figure 6).

Figure 6. Gate of sequence diagram.

  • Part Decomposition - An object can have more than one lifeline coming from it. This allows for inter- and intra-object messages to be displayed on the same diagram.

Figure 7. Part Decomposition of sequence diagram.

References:

sparxsystems (2009). "UML 2 Sequence Diagram". Received 5th May, 2009 from URL - http://www.sparxsystems.com.au/resources/uml2_tutorial/uml2_sequencediagram.html


5/04/2009

Exercise 20-part2

B. Class Diagram.

I learn the class diagram from IBM (2004) web site.

B1. Scope of class diagram
Class diagram provides an initial set of notation elements that all other structure diagrams use.

B2. The elements of class diagram
  • Class - UML uses a special name for these types: "classifiers." Generally, you can think of a classifier as a class, but technically a classifier is a more general term that refers to the other three types above as well. The UML representation of a class is a rectangle containing three compartments stacked vertically, as shown in the figure 1. The top compartment shows the class's name. The middle compartment lists the class's attributes. The bottom compartment lists the class's operations. When drawing a class element on a class diagram, you must use the top compartment, and the bottom two compartments are optional. (The bottom two would be unnecessary on a diagram depicting a higher level of detail in which the purpose is to show only the relationship between the classifiers.
Figure1. Class layout of class diagram.
  • Inheritance - It refers to the ability of one class (child class) to inherit the identical functionality of another class (super class), and then add new functionality of its own. To model inheritance on a class diagram, a solid line is drawn from the child class (the class inheriting the behavior) with a closed, unfilled arrowhead (or triangle) pointing to the super class. (See figure 2)

Figure 2. Inheritance layout of class diagram.

  • Bi-directional (standard) association -An association is a linkage between two classes. Associations are always assumed to be bi-directional; this means that both classes are aware of each other and their relationship, unless you qualify the association as some other type. Going back to our Flight example, the below figure shows a standard kind of association between the Flight class and the Plane class (See figure 3).

Figure 3. Association layout of class diagram

  • Packages - Packages enable modelers to organize the model's classifiers into namespaces, which is sort of like folders in a filing system. Dividing a system into multiple packages makes the system easier to understand, especially if each package represents a specific part of the system.(See figure 4)

Figure 4. Packages layout of class diagram.

  • Interfaces - It is considered to be a specialization of a class modeling element, please see the below figure that is an example package element that shows its members inside the package's rectangle boundaries. (See figure 5)

  • Figure 5. Interfaces layout of class diagram.


  • Aggregation - It is a special type of association used to model a "whole to its parts" relationship. In basic aggregation relationships, the lifecycle of a part class is independent from the whole class's lifecycle. There are 2 types of aggregation, the first one is basic aggregation that is an association with an aggregation relationship indicates that one class is a part of another class. In this kind of aggregation relationship, the child class instance can outlive its parent class (See figure 6). The second one is Composition aggregation that is the composition aggregation relationship that is just another form of the aggregation relationship, but the child class's instance lifecycle is dependent on the parent class's instance lifecycle.(See figure 7).


Figure 6. The basic aggregation of class diagram


Figure 7. The Composition aggregation of class diagram

Referances:

IBM (2004). "UML basics: The class diagram". Received 5th May, 2009 from URL - http://www.ibm.com/developerworks/rational/library/content/RationalEdge/sep04/bell/